I've entered in the data from the tables in Hirsch's Urban Revolt, and I've stored the files on github - here: github.com/tewhalen/urban_revolt
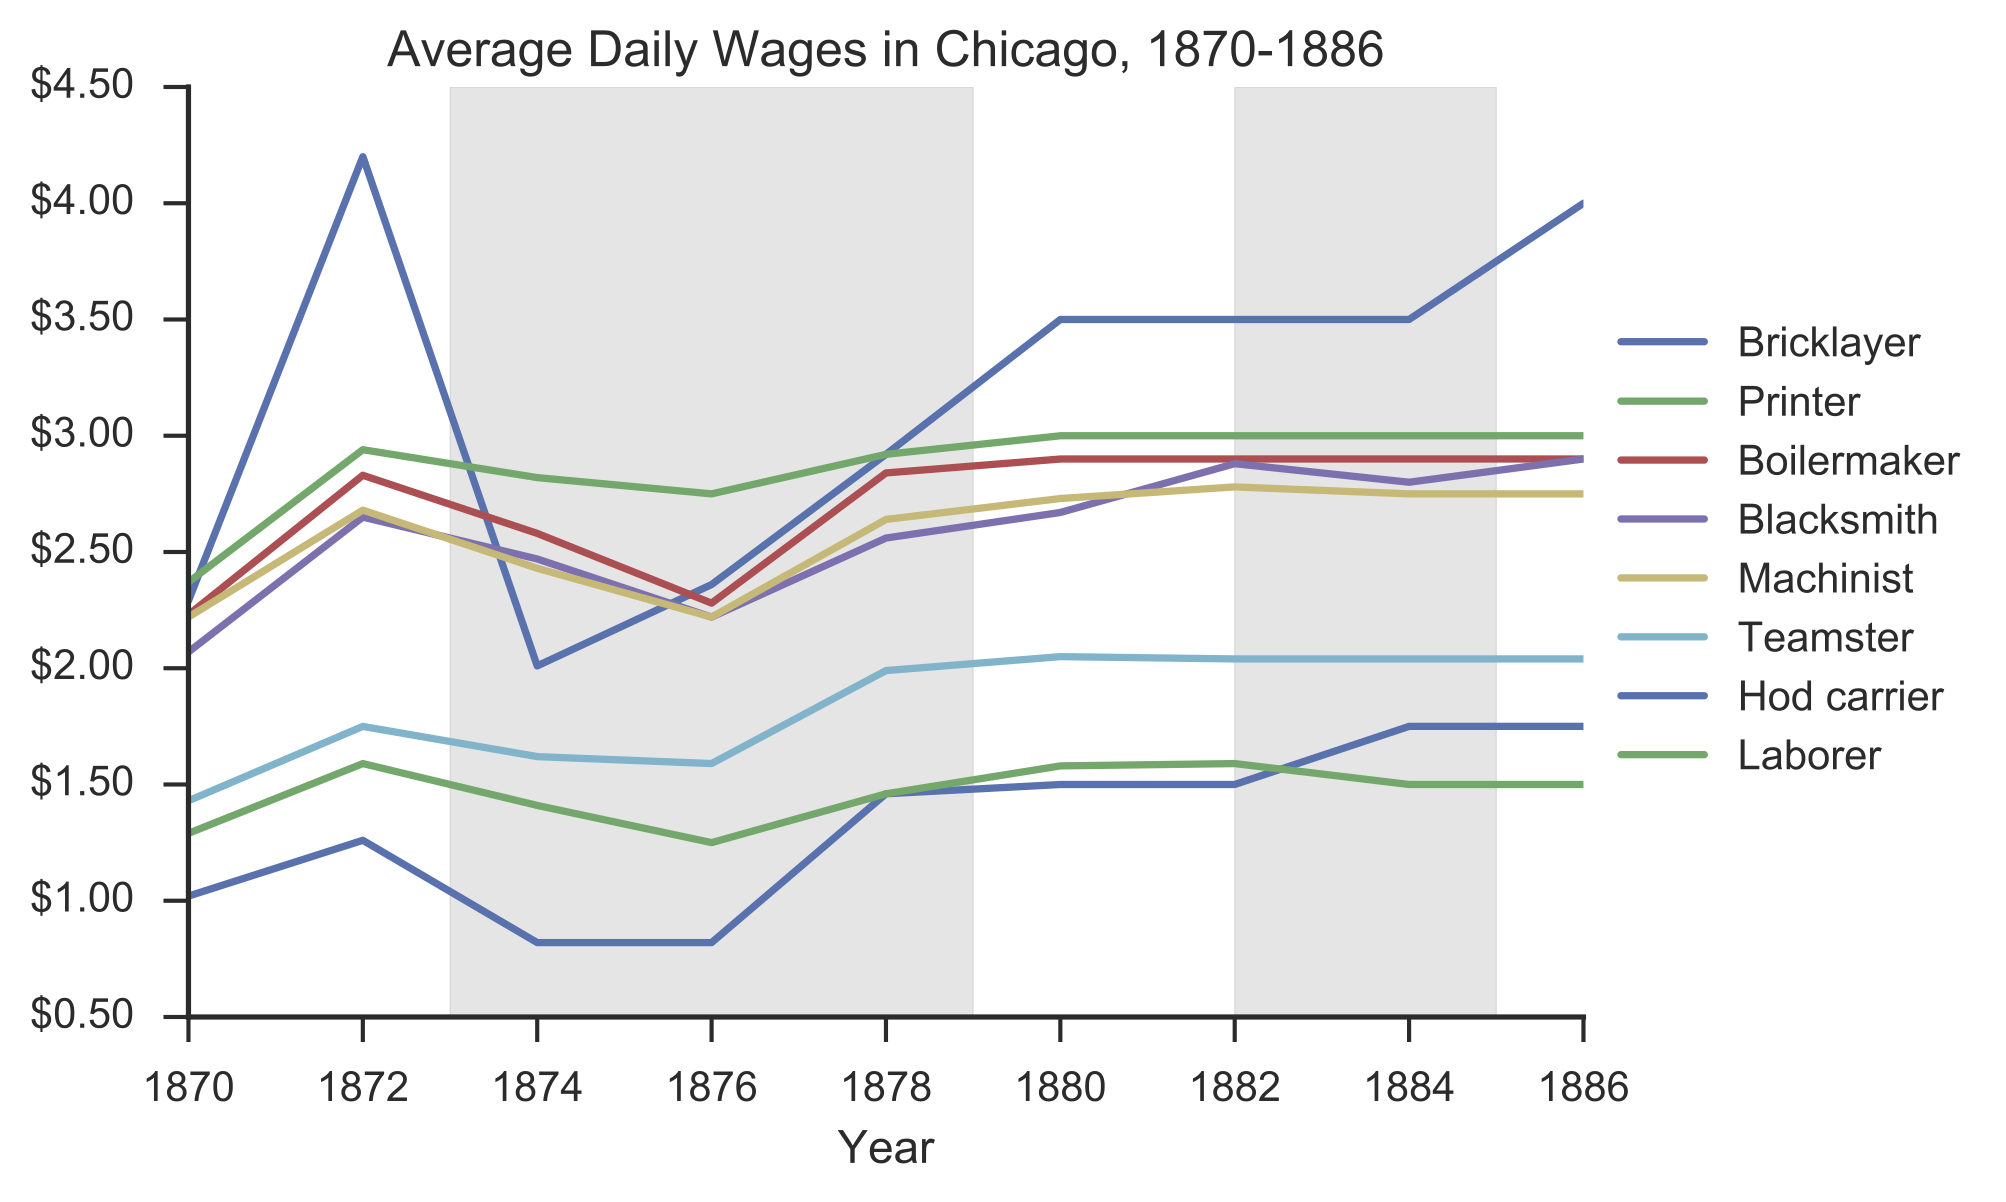
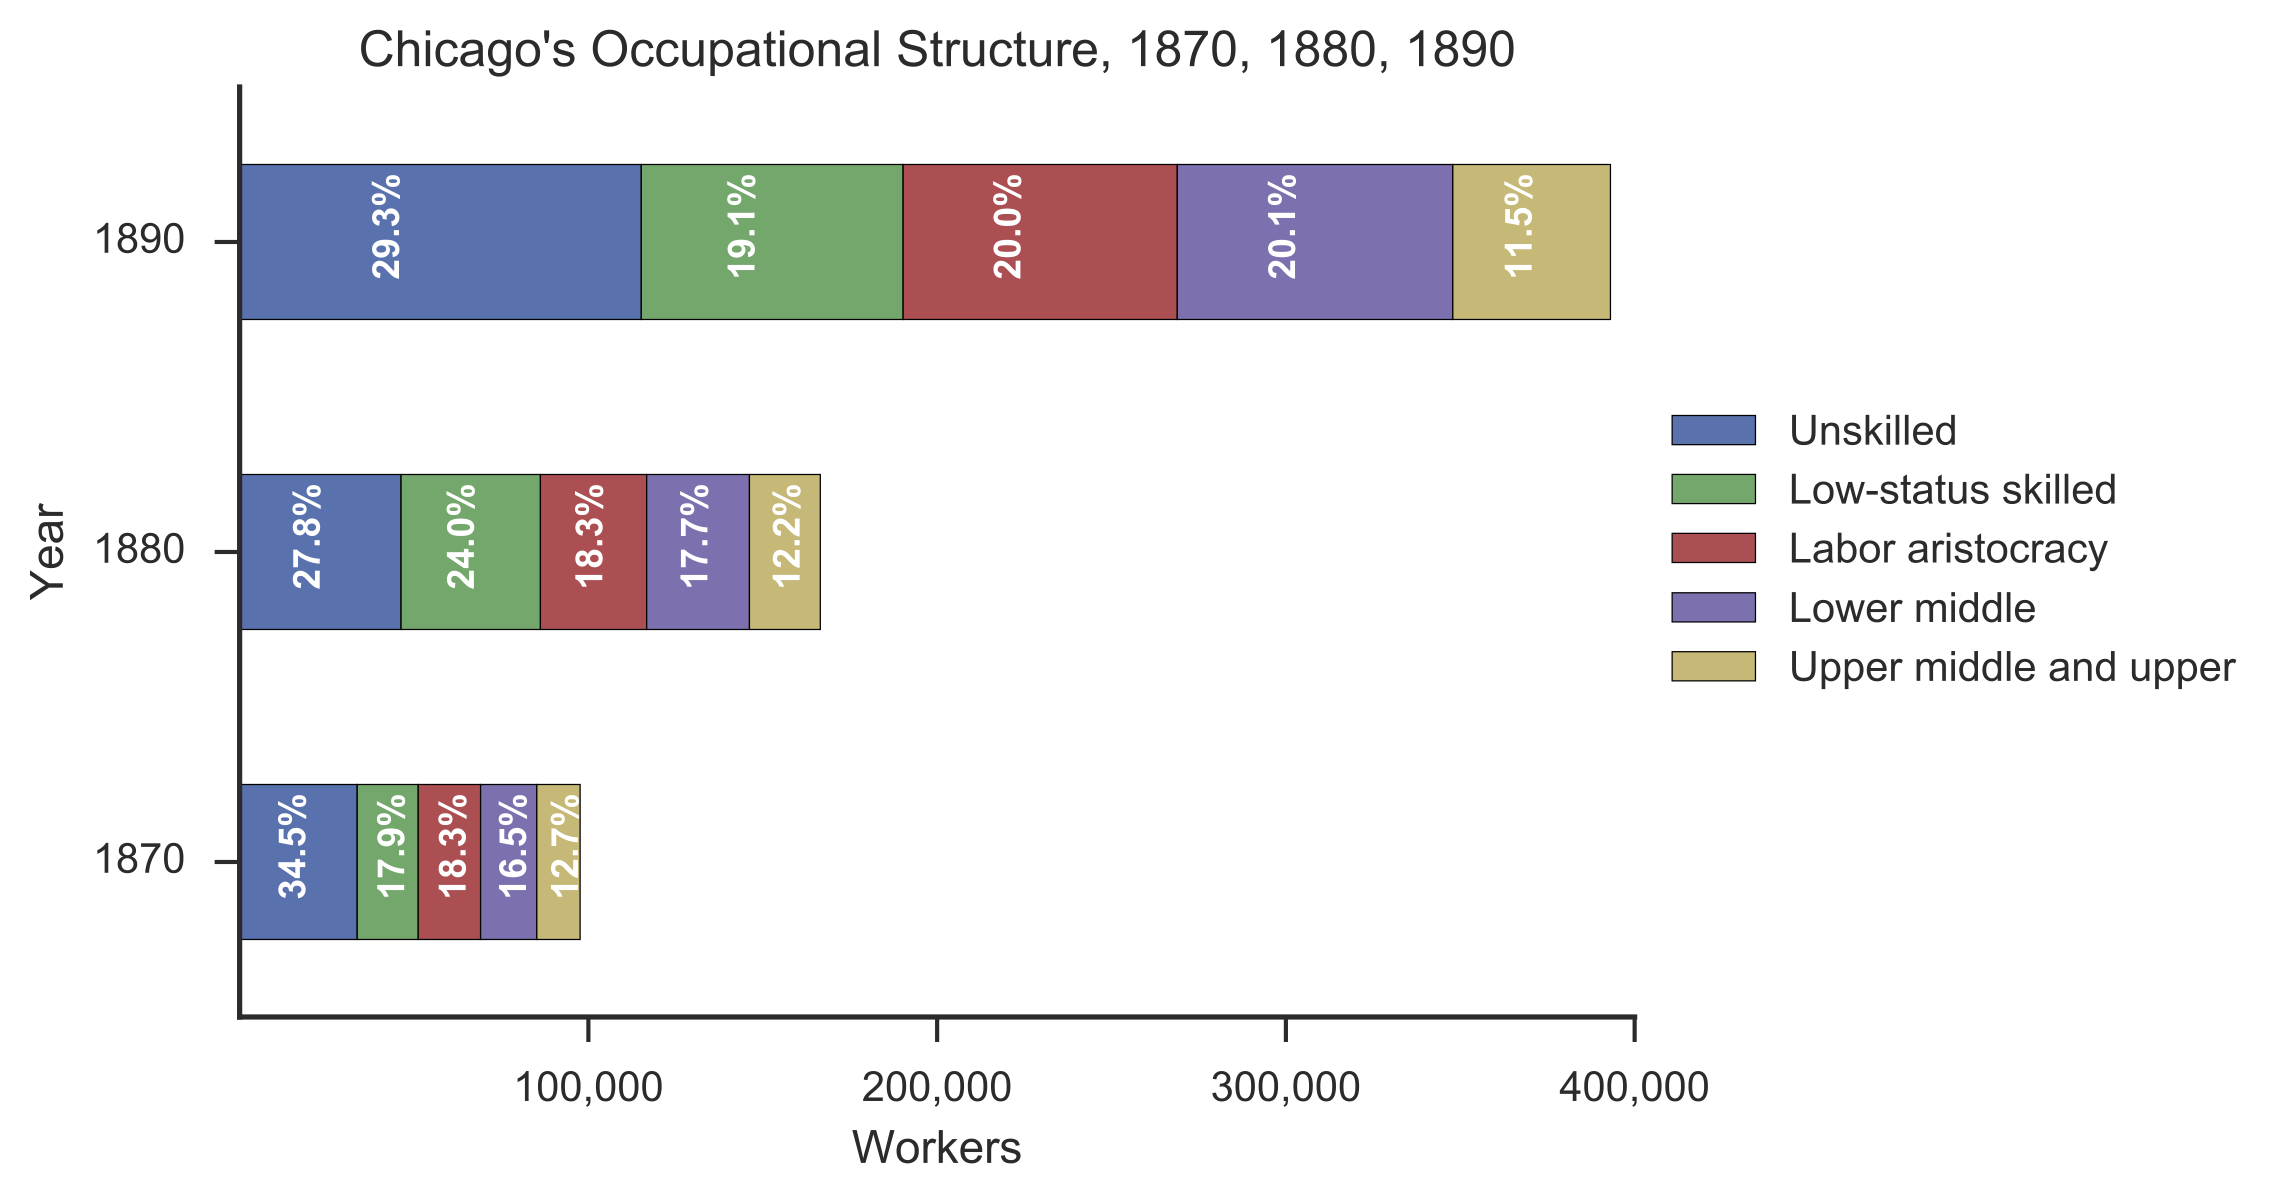
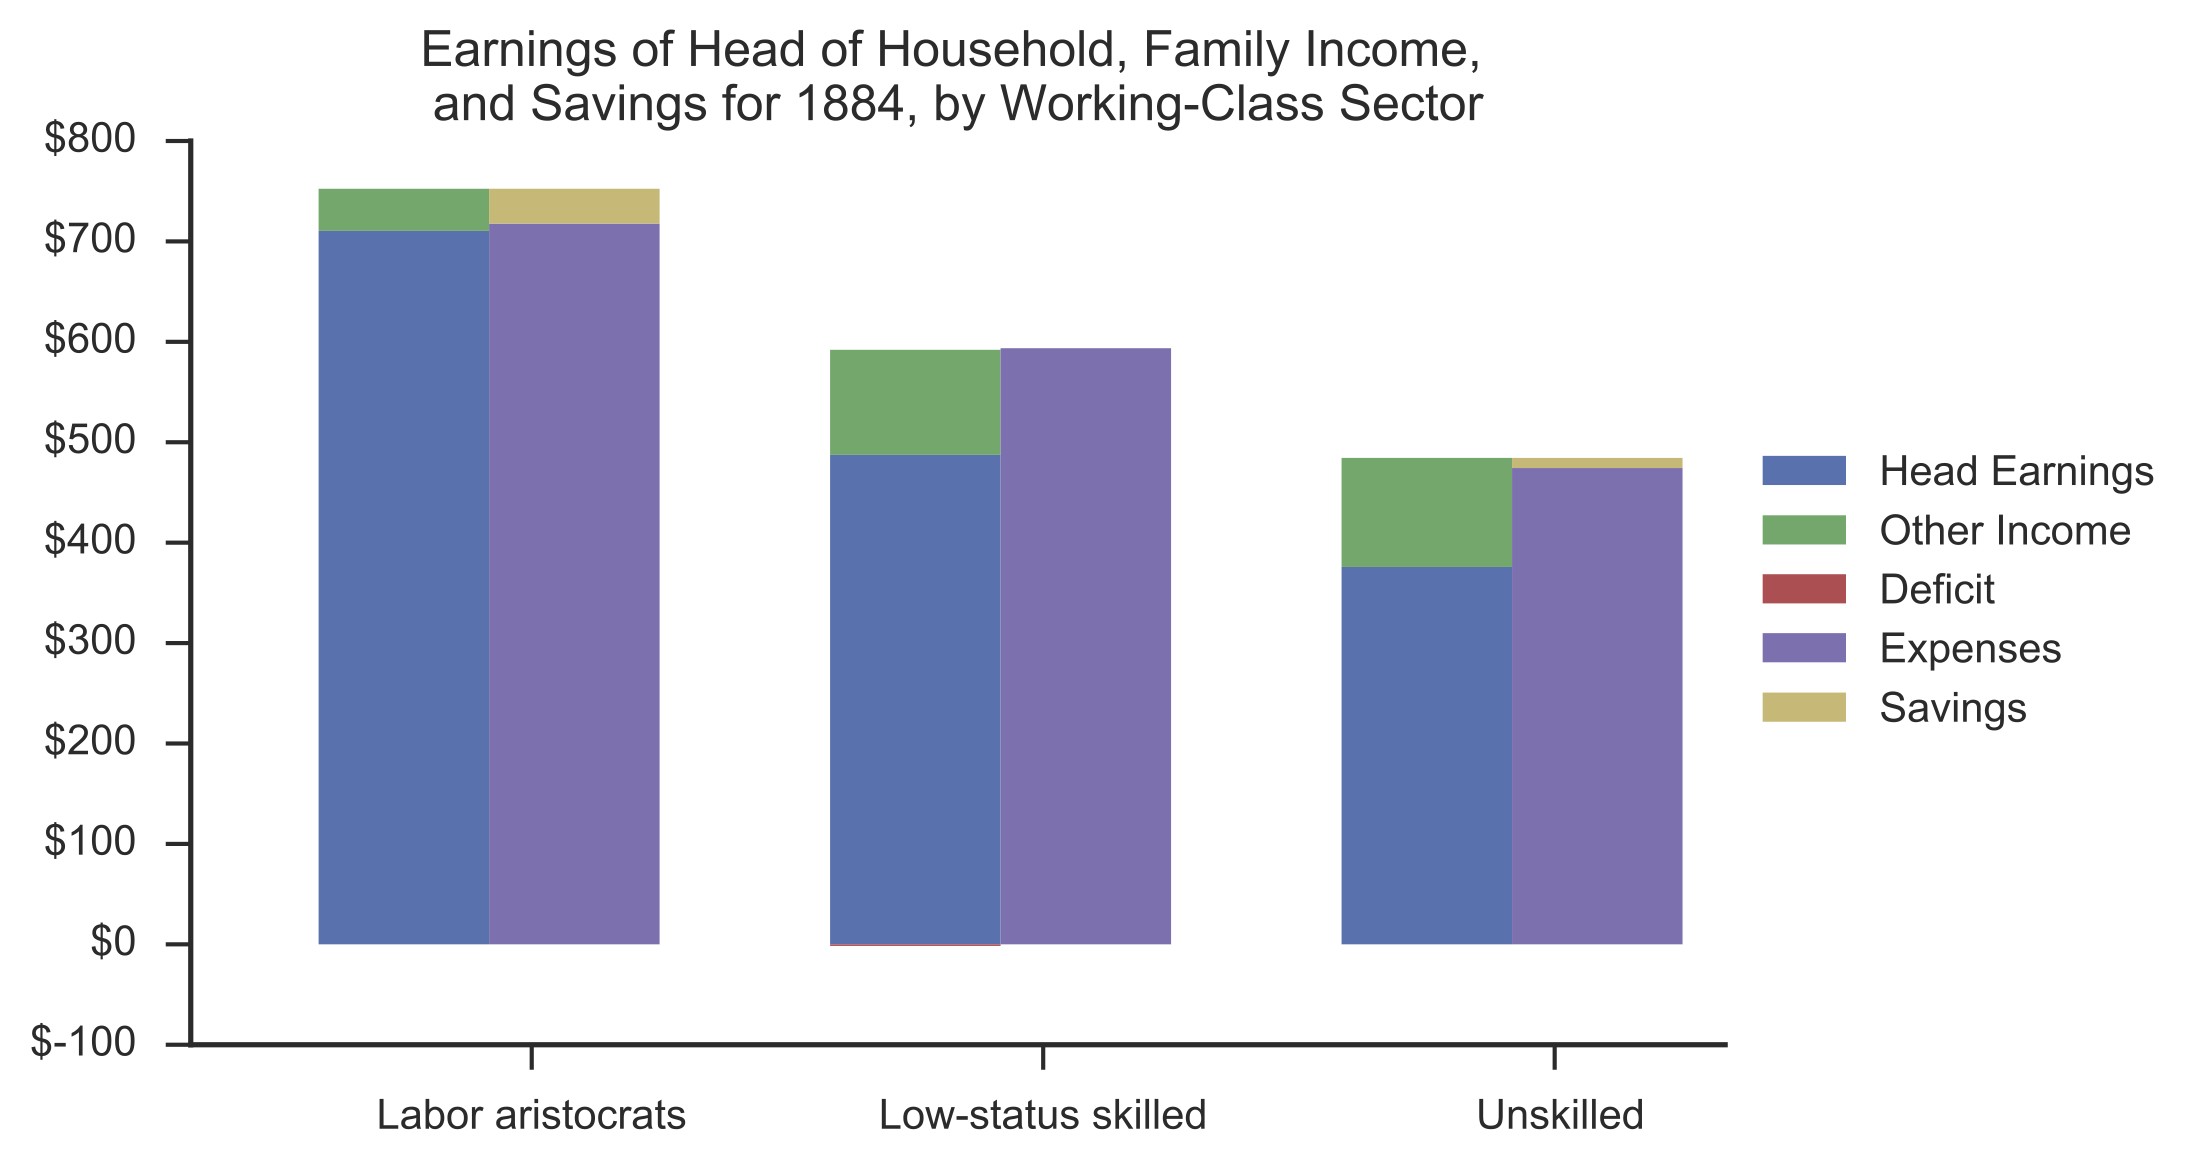
When plotted, you can get such interesting charts as:


I've entered in the data from the tables in Hirsch's Urban Revolt, and I've stored the files on github - here: github.com/tewhalen/urban_revolt
When plotted, you can get such interesting charts as:


