I wrote some code that will turn datasets for the 77 community areas of Chicago into simple cartograms, allowing quick-and-dirty visualizations. It's for Python, using matplotlib.
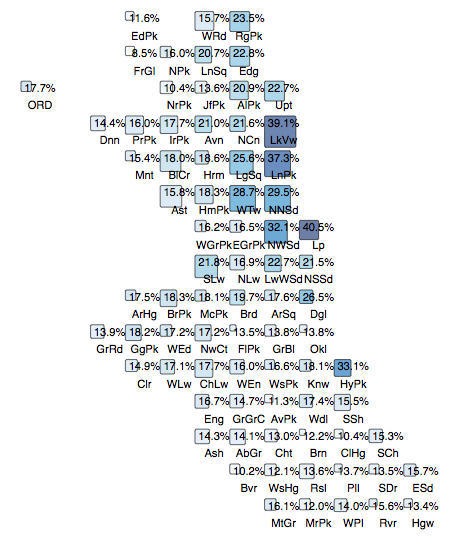
It can produce output like this, which shows the percentage of people 20-29 in each neighborhood, with each box sized according the number of people 20-29. See how all the youngs live in Lake View and Lincoln Park?