Wed 13 May 2015

Filed under chicago

Continuing my quixotic tilt against policies which treat the "hot" areas in Chicago as if they're great examples of complete neighborhoods, I made more charts.

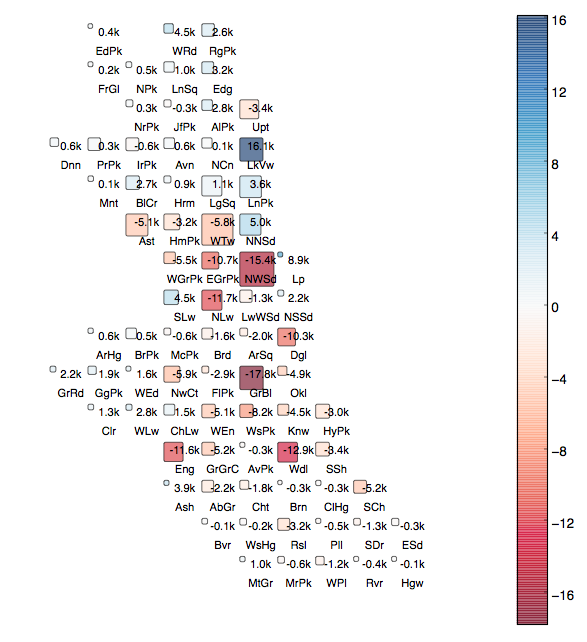
Earlier, I looked citywide at which neighborhoods are most atypical in terms of having a huge mass of young adults. Let's drill down a bit on a few of them.

graph of Lake View and Lincoln Park

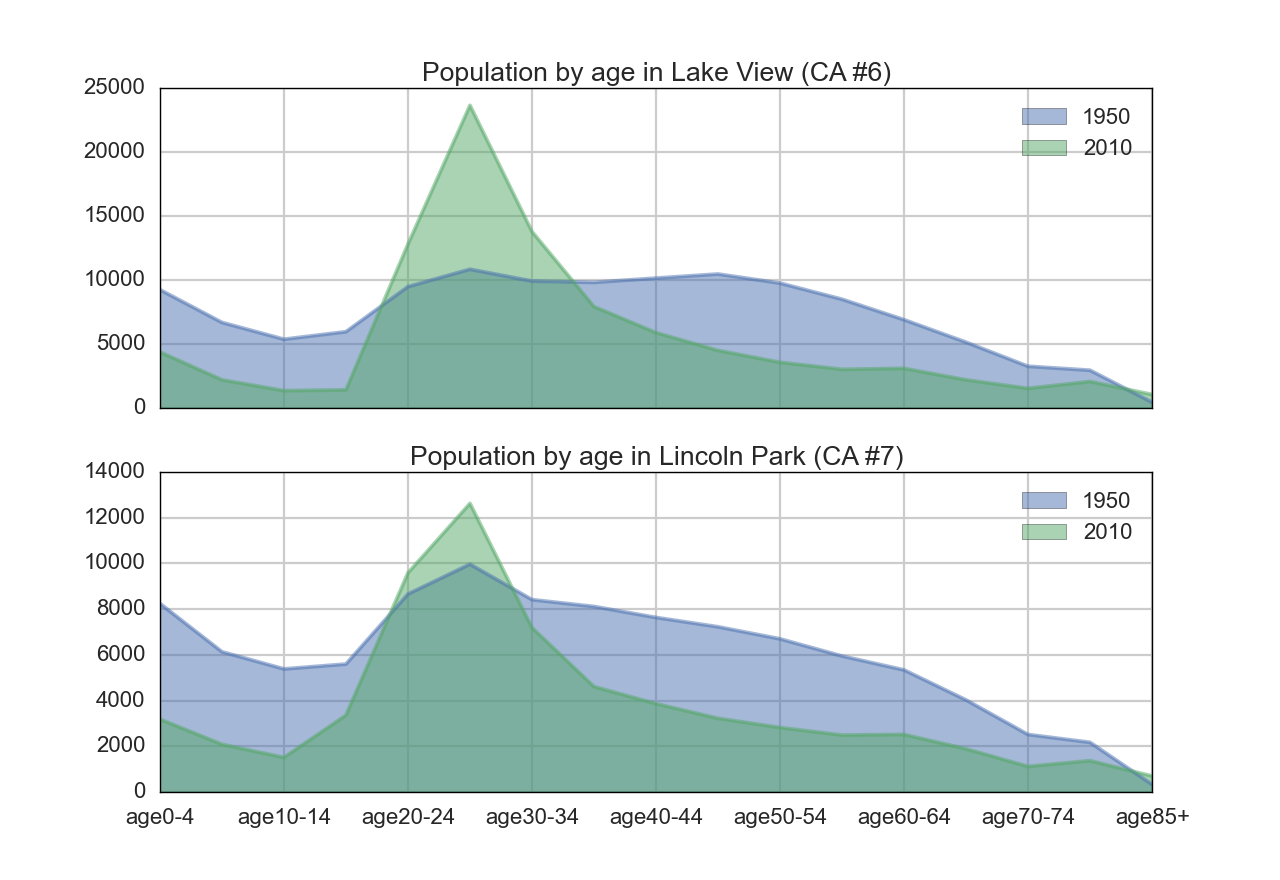
Here's Lake View and Lincoln Park. You probably don't need me to point out that what was once a gently-rolling landscape of ages is now a desert with a single mountain.

graph of Logan Square and West
!Town

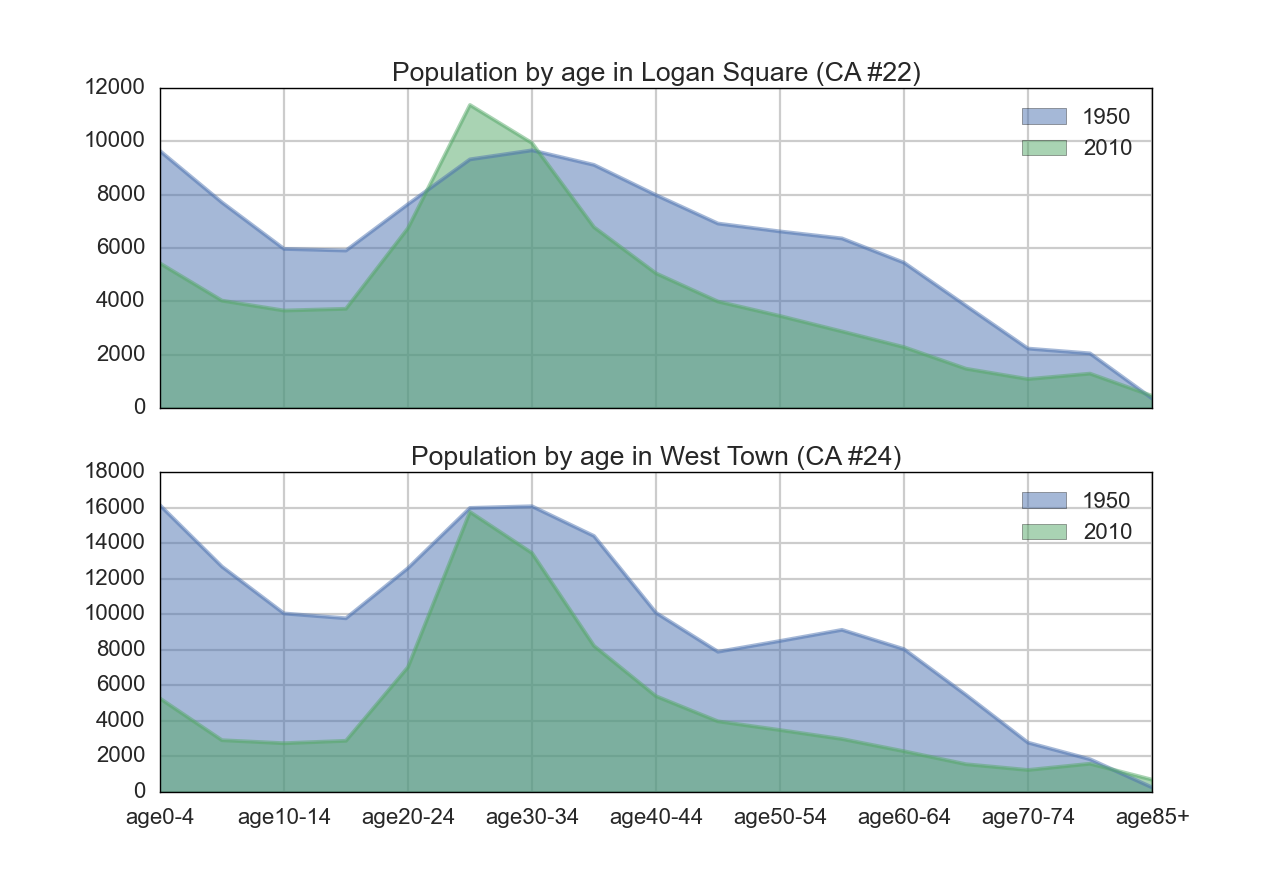
And here's Logan Square and West Town. Again, we see a similar pattern of change. These neighborhoods are more and more places where only young, childless adults want to live. Yes, they're "vibrant", yes, they're "desirable", but it is a limited sort of vibrancy, and a very narrow slice of the population that finds them desirable. And, look more closely at Logan Square: it's still "gentrifying", but is that gentrification really understood best as a change in the wealth of the population, or a transformation of the neighborhood age mix?

graph of Logan Square with notes

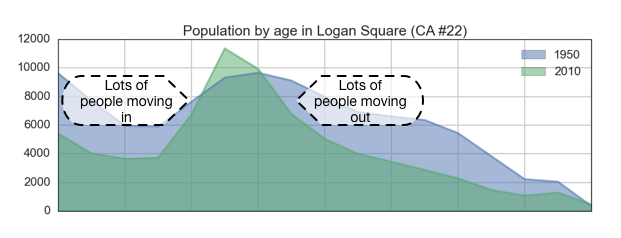
Note also that what makes these big peaks possible is a lot of transience. Transience relies on many factors outside of the neighborhood - places for people to come from, places for them to go, reasons for them to leave where they were, etc. If these factors change, what happens?

Comment

Fri 08 May 2015

Filed under chicago

You may have read a recent interview in the Chicago Reader with Rich Bowen about the book he wrote in 1983 with Dick Fay: "Hot Dog Chicago: A Native's Dining Guide". I dunno, I didn't read the article until I started writing this post. I have an ex-library copy of …

Read More

Sat 25 April 2015

Filed under chicago

graph of chicago hoods

Here's a cartogram of the change in the population of young adults, age 20-29, from 1950 to 2010, by community area. From 1950 to 2010, Chicago's population decreased by around 1 million people, but look: in some neighborhoods, the number of young adults actually increased, in some areas significantly!

This …

Read More

Sat 04 April 2015

Filed under chicago

graph of chicago hoods

Children age 0-3 per child age 4-7, by community area. Boxes scaled by number of kids age 0-3. A score around 1.0 would indicate that infants stay and become school-age children, a score above that means there's a net outflow as babies age. Basically, this shows the neighborhoods where …

Read More

introvert.net © ted whalen Powered by Pelican and Twitter Bootstrap. Icons by Font Awesome and Font Awesome More